

Realtor.com / Getty Images
Many homebuyers have noticed a change in their local housing markets: fewer “For Sale” signs.
The slim number of homes for sale in the U.S. has tightened further, making navigating the housing market a potentially grueling experience for those considering purchasing a home. In July there were 6.4% fewer listings on Realtor.com® than a year earlier—when the nation was already suffering an extreme shortage of homes for sale.
But the crisis-level inventory shortages aren’t happening everywhere—in fact, there are some markets bucking the trend and seeing an increase in the number of homes going on the market.
Confused? You’re not alone.
That’s why the Realtor.com® data team stepped in to help folks make sense of this perplexing market. We identified the metropolitan areas where the supply of homes has spiked—and where it has plummeted.
Only 31 of the 100 largest metropolitan areas experienced an increase in the number of homes for sale in July compared with a year earlier. That means inventory dropped in the other 69 metros.
“Either buyer demand is outpacing listing activity,” says Realtor.com economic research analyst Hannah Jones, “or new listing activity is so low that it’s eating into the active inventory.”
Fewer homes on the market makes it even more difficult for buyers to find a place—and afford it. They’re grappling with near-record-high home prices, mortgage interest rates hovering around 7%, and bidding wars and offers over the asking price because there are too many buyers competing over too few homes.
Low inventory has become something of a self-fulfilling prophecy. Many sellers are frozen by the realization that, once they sell, they’ll join the ranks of those affordability-crunched buyers, hunting for their next home in this limited-supply landscape. Many are also loath to take on a new mortgage at a higher rate. It’s a complex game of musical chairs, where every decision requires caution and strategy.
The metros with the largest drops in inventory tend to be more affordable destinations, or places that became extremely popular with buyers during the COVID-19 pandemic.
As new residents flocked to these pandemic hot spots over the past few years, prices soared and inventory dropped. Now that these markets have cooled off a bit, and sellers can’t command the same stratospheric prices, many are choosing to hang on to their properties rather than putting them up for sale.
“Prices got so high, then inventory built up, then buyer demand tapered,” Jones says.
The places that are seeing the biggest increases in homes for sale are generally the more affordable Southern and Midwestern markets. They also became more desirable during the pandemic, but prices didn’t rise quite so high, so quickly.
“These markets were really hot,” Jones says of markets like Cape Coral, FL, New Orleans, and Memphis, TN. “But buyer demand has waned, so now homes are sitting on the market longer and active listings are accruing.”
To figure out where the number of homes for sale is rising and falling, we looked at the 100 largest metropolitan areas. We scoured the active listings on Realtor.com in July of this year and compared the number of listings with July of last year. We selected only one metro per state with the biggest percentage change, to ensure geographic diversity. (Metros include the main city and surrounding towns, suburbs, and smaller urban areas.)
Here’s a look at the areas of the country with the biggest swings in active inventory.
Metros with the largest drops in homes for sale
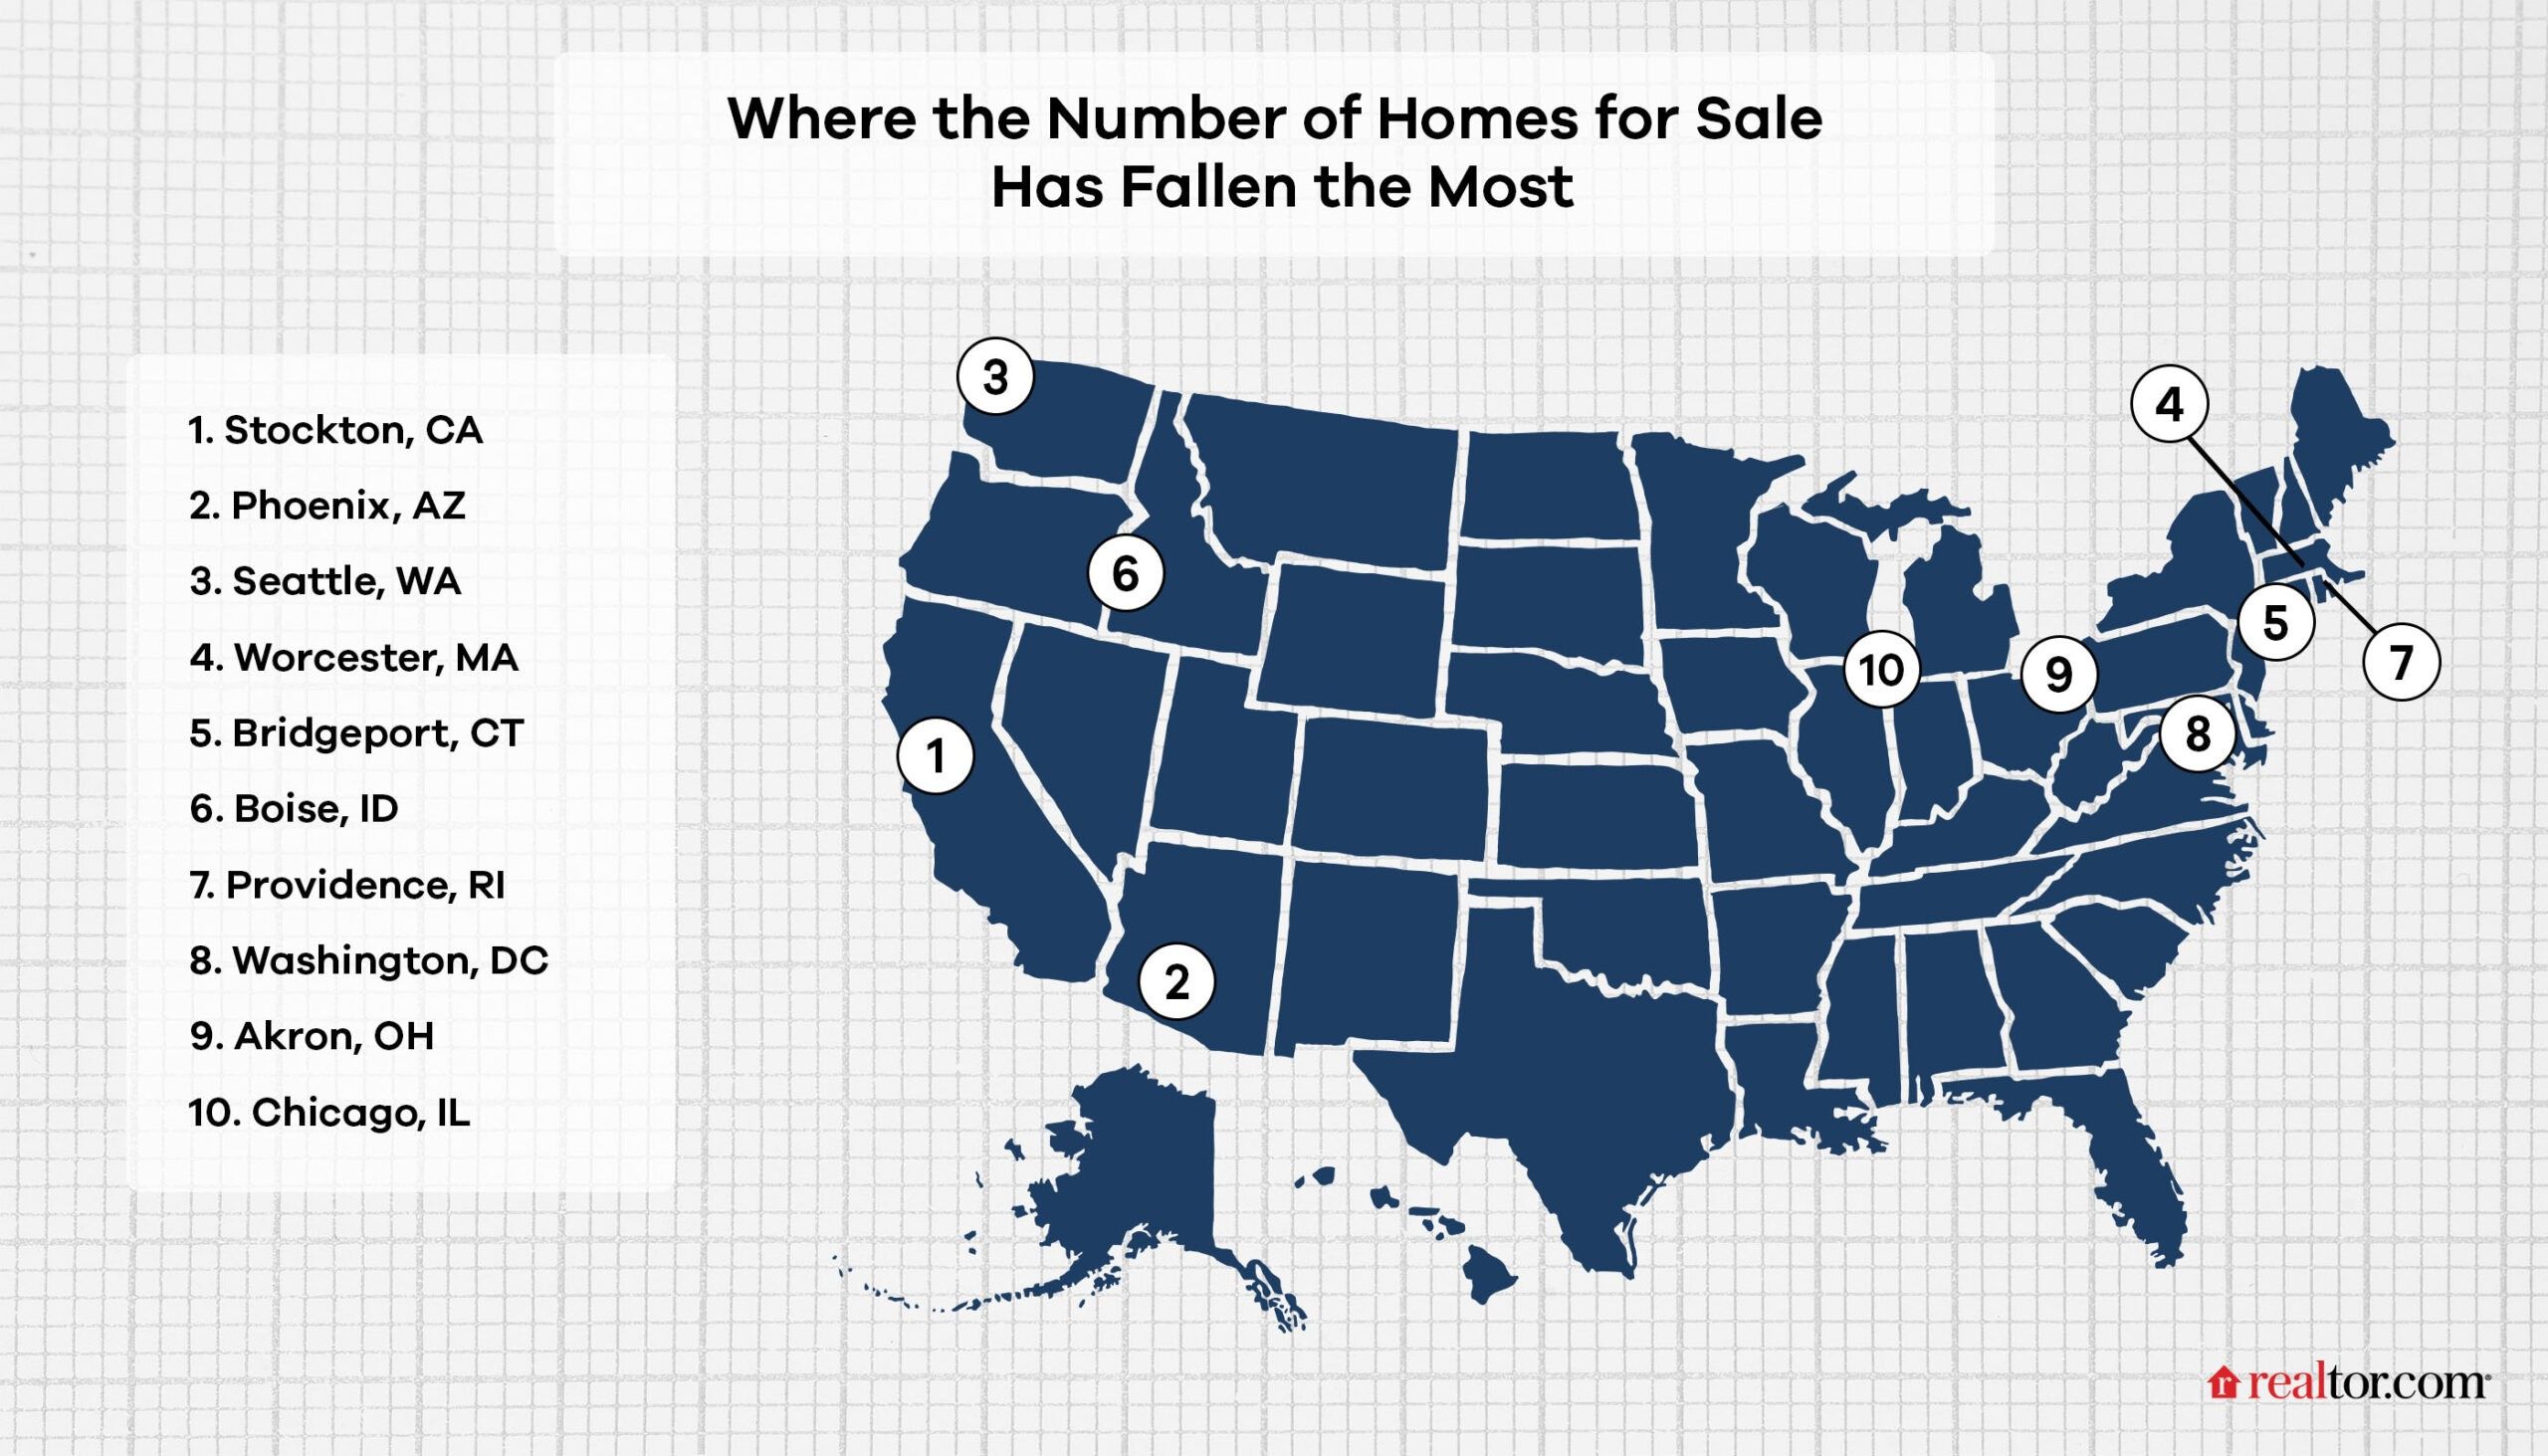
1. Stockton, CA
July median list price: $587,800
July active listings: 579
Year-over-year change in active listings: -56.2%
One of the biggest draws for homebuyers looking at properties in Stockton, a medium-sized California city about two hours east of San Francisco, is the lower prices compared with nearby Golden State locations. The median home price in Stockton is roughly half of that in San Francisco and 15% less than in Sacramento, an hour to the north.
“Stockton is one of the few affordable markets in California,” Jones says. That’s led the number of homes for sale to fall as home shoppers buy up cheaper properties.
Potential sellers have been on a roller coaster of emotions here, says Jerry Patterson, a local real estate agent with Cornerstone Real Estate. They know they can sell their home easily now, but will have a hard time finding the next home without having to downsize or pay more every month.
“One minute, they’re ready to jump back into the market,” he says. “The next minute, they get back in their shell.”
Patterson says he’s especially seen a drop-off in trade-up sellers.
“Usually, I can set my clock to it: It’s the couple who bought their home four years ago, they did a bunch of upgrades, and they’re ready to move up to the next one,” Patterson says.
But, lately, “they’re sitting on the sidelines. Those sellers don’t see an opportunity to make the next purchase,” he adds.
2. Phoenix, AZ
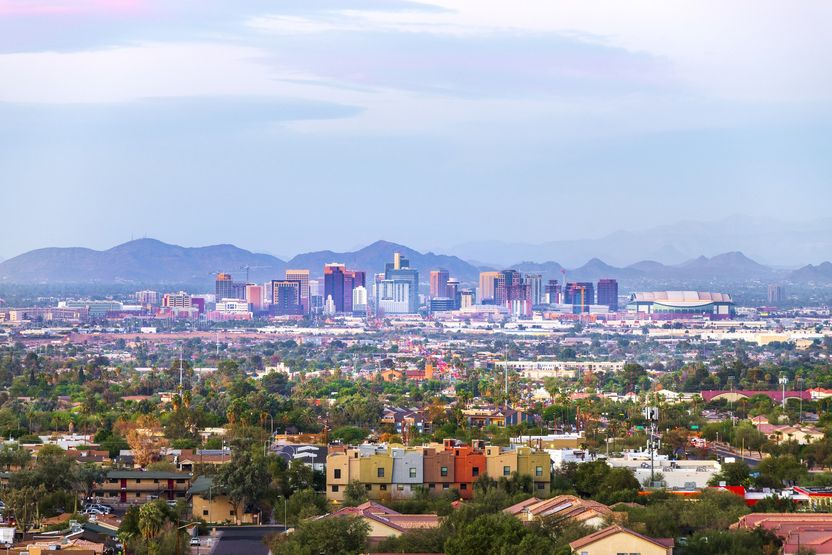
Getty Images
July median list price: $539,900
July active listings: 8,232
Year-over-year change in active listings: -42.4%
The Phoenix housing market is typified by big swings. In the 2000s, it was one of the areas that saw home prices explode, only to see a sharp crash, followed by an entrenched housing slump that took years to rebound.
So it might not come as a huge surprise to see Phoenix on the list of places with a big drop in the number of homes for sale.
“About a year ago, inventory was really high in Phoenix,” says Jones, of Realtor.com. “But the prices got so high during the pandemic that buyer demand just fell off.”
Potential sellers responded by holding off on listing their properties. That’s resulted in a downturn in homes for sale.
For a bit over the area’s median price, home shoppers who act fast can find a three-bedroom midcentury bungalow in central Phoenix with modern updates throughout.
3. Seattle, WA
July median list price: $815,000
July active listings: 4,267
Year-over-year change in active listings: -38.7%
Seattle is known for its abundance of natural beauty, with stunning scenery like Puget Sound and Mount Rainier. It’s also a hub for the tech and aerospace sectors and home to companies such as Microsoft, Amazon, and Boeing.
The area’s housing market has been relatively expensive for years, but most recently, it has become known for the lack of homes for sale.
This same time last year, there were almost 7,000 homes for sale in the Seattle metro area. Now, it’s just shy of 4,300. And this comes while home prices are only about 1% below their all-time median peak last summer, at $824,995.
Experts believe this is due to higher mortgage rates, enticing would-be sellers to stay put.
For close to the average price, buyers can get a two-bedroom home in Seattle’s Seward Park neighborhood, boasting a mix of contemporary styling with a midcentury dash.
4. Worcester, MA
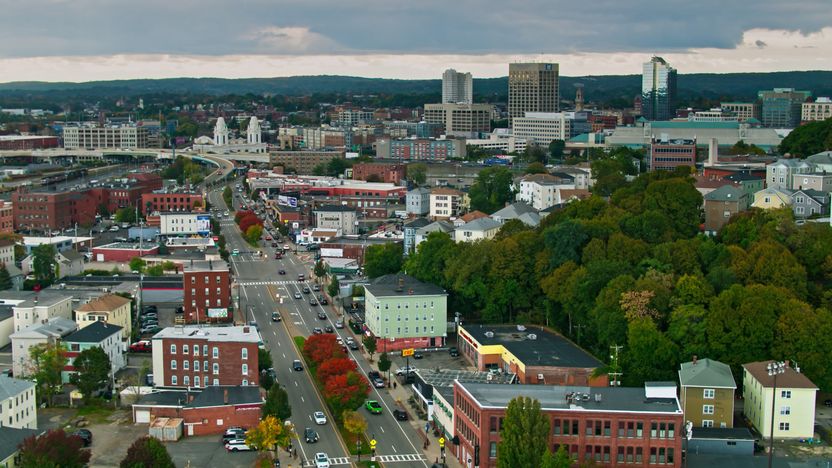
Getty Images
July median list price: $518,900
July active listings: 731
Year-over-year change in active listings: -37.2%
The largely suburban metro of Worcester (it roughly rhymes with “rooster”) sits in Central Massachusetts and has been a popular destination for home shoppers leaving large, East Coast population centers like New York City and Boston.
Even with home prices 18% above the national average of $440,000, homes in Worcester cost dramatically less than in areas such as Cambridge, MA, and Boston’s downtown or Back Bay neighborhoods, where median home prices can top $2 million.
Demand is still high in the area as the average home sells in just 25 days, almost three weeks faster than the national average right now.
“It’s been four or five years now, where inventory levels have been dropping,” says Nick McNeil, a real estate agent with McNeil Real Estate in Worcester. “This the lowest number of houses listed in Massachusetts since we’ve been tracking it.”
5. Bridgeport, CT
July median list price: $1,099,500
July active listings: 1,329
Year-over-year change in active listings: -36.4%
Bridgeport is another hot East Coast market that’s been drawing home buyers from nearby pricy urban population hubs similar to Worcester—except the homes in Bridgeport cost around twice as much. The wealthy Connecticut towns that make up Fairfield County stand out as the most expensive of any place on our list.
The median home price in the Bridgeport metro area, which includes Norwalk and Stamford, is more than $1 million. That’s less than in Manhattan and about the same as in Brooklyn, but with more options, from urban condos along the coast to more rural towns like Redding and Easton.
Matthew Murray, a real estate agent with Higgins Group in Fairfield, says the market is brutal for buyers because of the shortage of homes available right now.
“We had an offer on a home where they were asking $499,000,” Murray says. “We went in with an offer for $560,000. There were 62 offers, and it sold for $620,000.”
For sellers Murray is working with, it’s the opposite.
“Another client put their house in the Black Rock area of Bridgeport on the market for $325,000,” he says of a recent sale he worked on. “We had four offers and sold for $370,000.”
At every price point, inventory just cannot keep up with demand, he says.
“The demand is incredible,” he says, “and there’s practically no inventory to speak of.”
Rounding out the top 1o were pandemic darling Boise, ID, where the median list price was $599,000 and the number of active listings fell 35.9%. It was followed by Providence, RI, at $550,000, where inventory dropped 32.8%; Washington, DC, at $635,000, where inventory was down 31.5%; Akron, OH, at $230,000, where inventory fell 30.5%; and Chicago, at $389,000, where inventory dropped 29.2%.
Metros with the largest increases in homes for sale
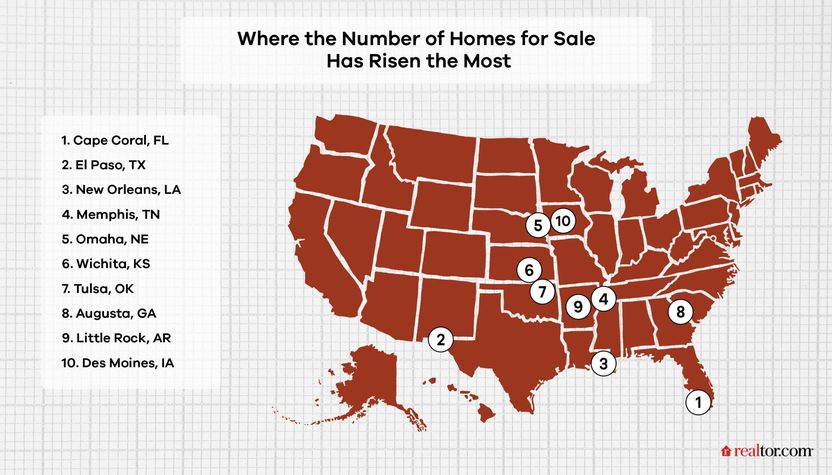
1. Cape Coral, FL
July median list price: $480,000
July active listings: 5,924
Year-over-year change in active listings: +51.1%
Cape Coral, one of Southwest Florida’s Gulf Coast metros, is known for its canals and white-sand beaches—and now, its big rise in homes on the market.
While most areas of the country are still in an inventory squeeze with prices holding steady, some areas saw such ramped-up demand during the pandemic that now, even with historically low inventory, it’s up compared with one year ago. That makes sense given that U.S. Census Bureau data showed Cape Coral as one of the fastest-growing cities in America.
But that elevated demand caused prices to rise 40% in 2021 and early 2022. Now, prices have plateaued, demand has pulled back, and the number of days it takes a home to sell is ticking up.
All that means the active inventory figures are growing, but they’re still not to pre-pandemic levels. There would need to be another 40% jump in active listings to get back to where things were in July 2019.
Buyers can score this three-bedroom, two-bathroom house for $301,000 or a newly constructed four-bedroom, three-bathroom house for about $433,000.
2. El Paso, TX

Getty Images
July median list price: $304,800
July active listings: 2,112
Year-over-year change in active listings: +40.9%
El Paso, a bustling midsized metro that sits along the border with Mexico, stands out for its blend of Mexican and American cultures. The city is also one of the most affordable places with a growing year-over-year inventory right now, with home prices 30% below the national average.
With such affordable prices and a cross-cultural community not unlike that of Southern California, the metro continues to see a stream of California buyers, though it’s maybe slowed over the past year, says Alex Cordova, a real estate agent with JP & Associates Realtors in El Paso.
“They were buying in cash,” he says, “because $400,000 is cheap compared to what they’re selling their home for there.”
3. New Orleans, LA
July median list price: $339,999
July active listings: 4,196
Year-over-year change in active listings: +39.6%
Listings are accumulating in the Crescent City, up almost 40% compared with July 2022. That means they’re only about 10% below pre-pandemic levels.
Unlike many other areas of the country, prices have been relatively steady in New Orleans, even seeing a slight dip earlier this year, as we noted in our roundups of where prices declined at the beginning of the year.
If anywhere on our list is approaching a more “normal” market, it might be The Big Easy. Aside from a relatively short dip in the number of days the average listing took to sell in 2022 and a modest pandemic price surge in 2021 and 2022, the New Orleans housing market is relatively stable, our core metrics show.
For near the median home list price, buyers can score a new, three-bedroom home with contemporary styling in the Gentilly neighborhood near Lake Pontchartrain.
4. Memphis, TN

Getty Images
July median list price: $325,000
July active listings: 2,728
Year-over-year change in active listings: +33.2%
Memphis was seeing increasing demand and diminishing inventory for years before the pandemic frenzy. In late 2019, the number of listings was nearly half what it had been three years ago, with a healthy 8% to 9% annual home appreciation. Yet, it remains one of the last major markets where buyers can find lots of homes still available for below $200,000.
This has made it popular with investors who have been buying homes in the metro for years. In the middle of the pandemic, the number of active listings here dropped to below 1,000, around one-third of what’s available now, and about one-quarter of what was available in 2017 and 2018.
But prices have leveled off and inventory has been stacking up since late 2022, showing the point at which buyers’ budgets and mortgage interest rates finally put a cap on the area’s price growth—for now.
About $300,000 will get a one-bedroom condo right on the Mississippi River or a classic four-bedroom bungalow in Memphis’ historic Evergreen suburb.
5. Omaha, NE
July median list price: $400,000
July active listings: 1,666
Year-over-year change in active listings: +26.4%
Halfway between Denver and Chicago, Omaha is home to several Fortune 500 companies, including Warren Buffett’s international holding company, Berkshire Hathaway. All of those workers need places to live, so the rebound in housing inventory is welcome news to the local market.
After a couple of years of especially limited supply, Omaha’s inventory hit the same level in July that it was in July 2020. That’s more than most places can boast now.
The law of supply and demand still applies as expected in Omaha as well. Home prices in the metro have dipped about 9% from their high last year as more homes have come on the market, although they’re still up 5% year over year.
But prices are still about 10% below the national average, offering some more affordable options for buyers.
For about the median list price, buyers can find a charming three-bedroom home on a half-acre in Omaha’s Ponca Hills neighborhood.
Rounding out the top 1o was Wichita, KS, which had a median list price of $300,850 and 22.4% jump in the number of homes for sale. Next up was Tulsa, OK, at $364,000 with a 21.9% rise in inventory; Augusta, GA, at $309,900 with an 18.2% inventory jump, Little Rock, AR, at $325,000 with an 11.5% increase in inventory; and Des Moines, IA, at $374,900 and a 10.1% bump in inventory.
The post Where Are All the Homes? See the 10 Cities With the Largest Jump in Listings—and 10 With the Biggest Drop appeared first on Real Estate News & Insights | realtor.com®.